Data-Driven Growth
The Analytics Dashboard Built for Frontline Performance
SparkPlug Analytics gives you real-time visibility into sales performance, campaign ROI, and team engagement — so you always know what's working and where to focus next.
.png?width=2000&height=1500&name=sparkplug-analytics-01-performance-transparent%20(1).png)
Real-Time Data
Performance at a Glance
Track revenue, units sold, and trends across every store and product — all connected live to your point-of-sale. No manual exports. No waiting until Monday.
- Live POS-connected data— Standings and sales figures update the moment a transaction closes.
- Location and SKU breakdowns— Drill into any store, region, or product to see exactly what's moving.
- Custom date range comparisons— Compare any two time periods side by side to spot trends fast.
Prove What Works
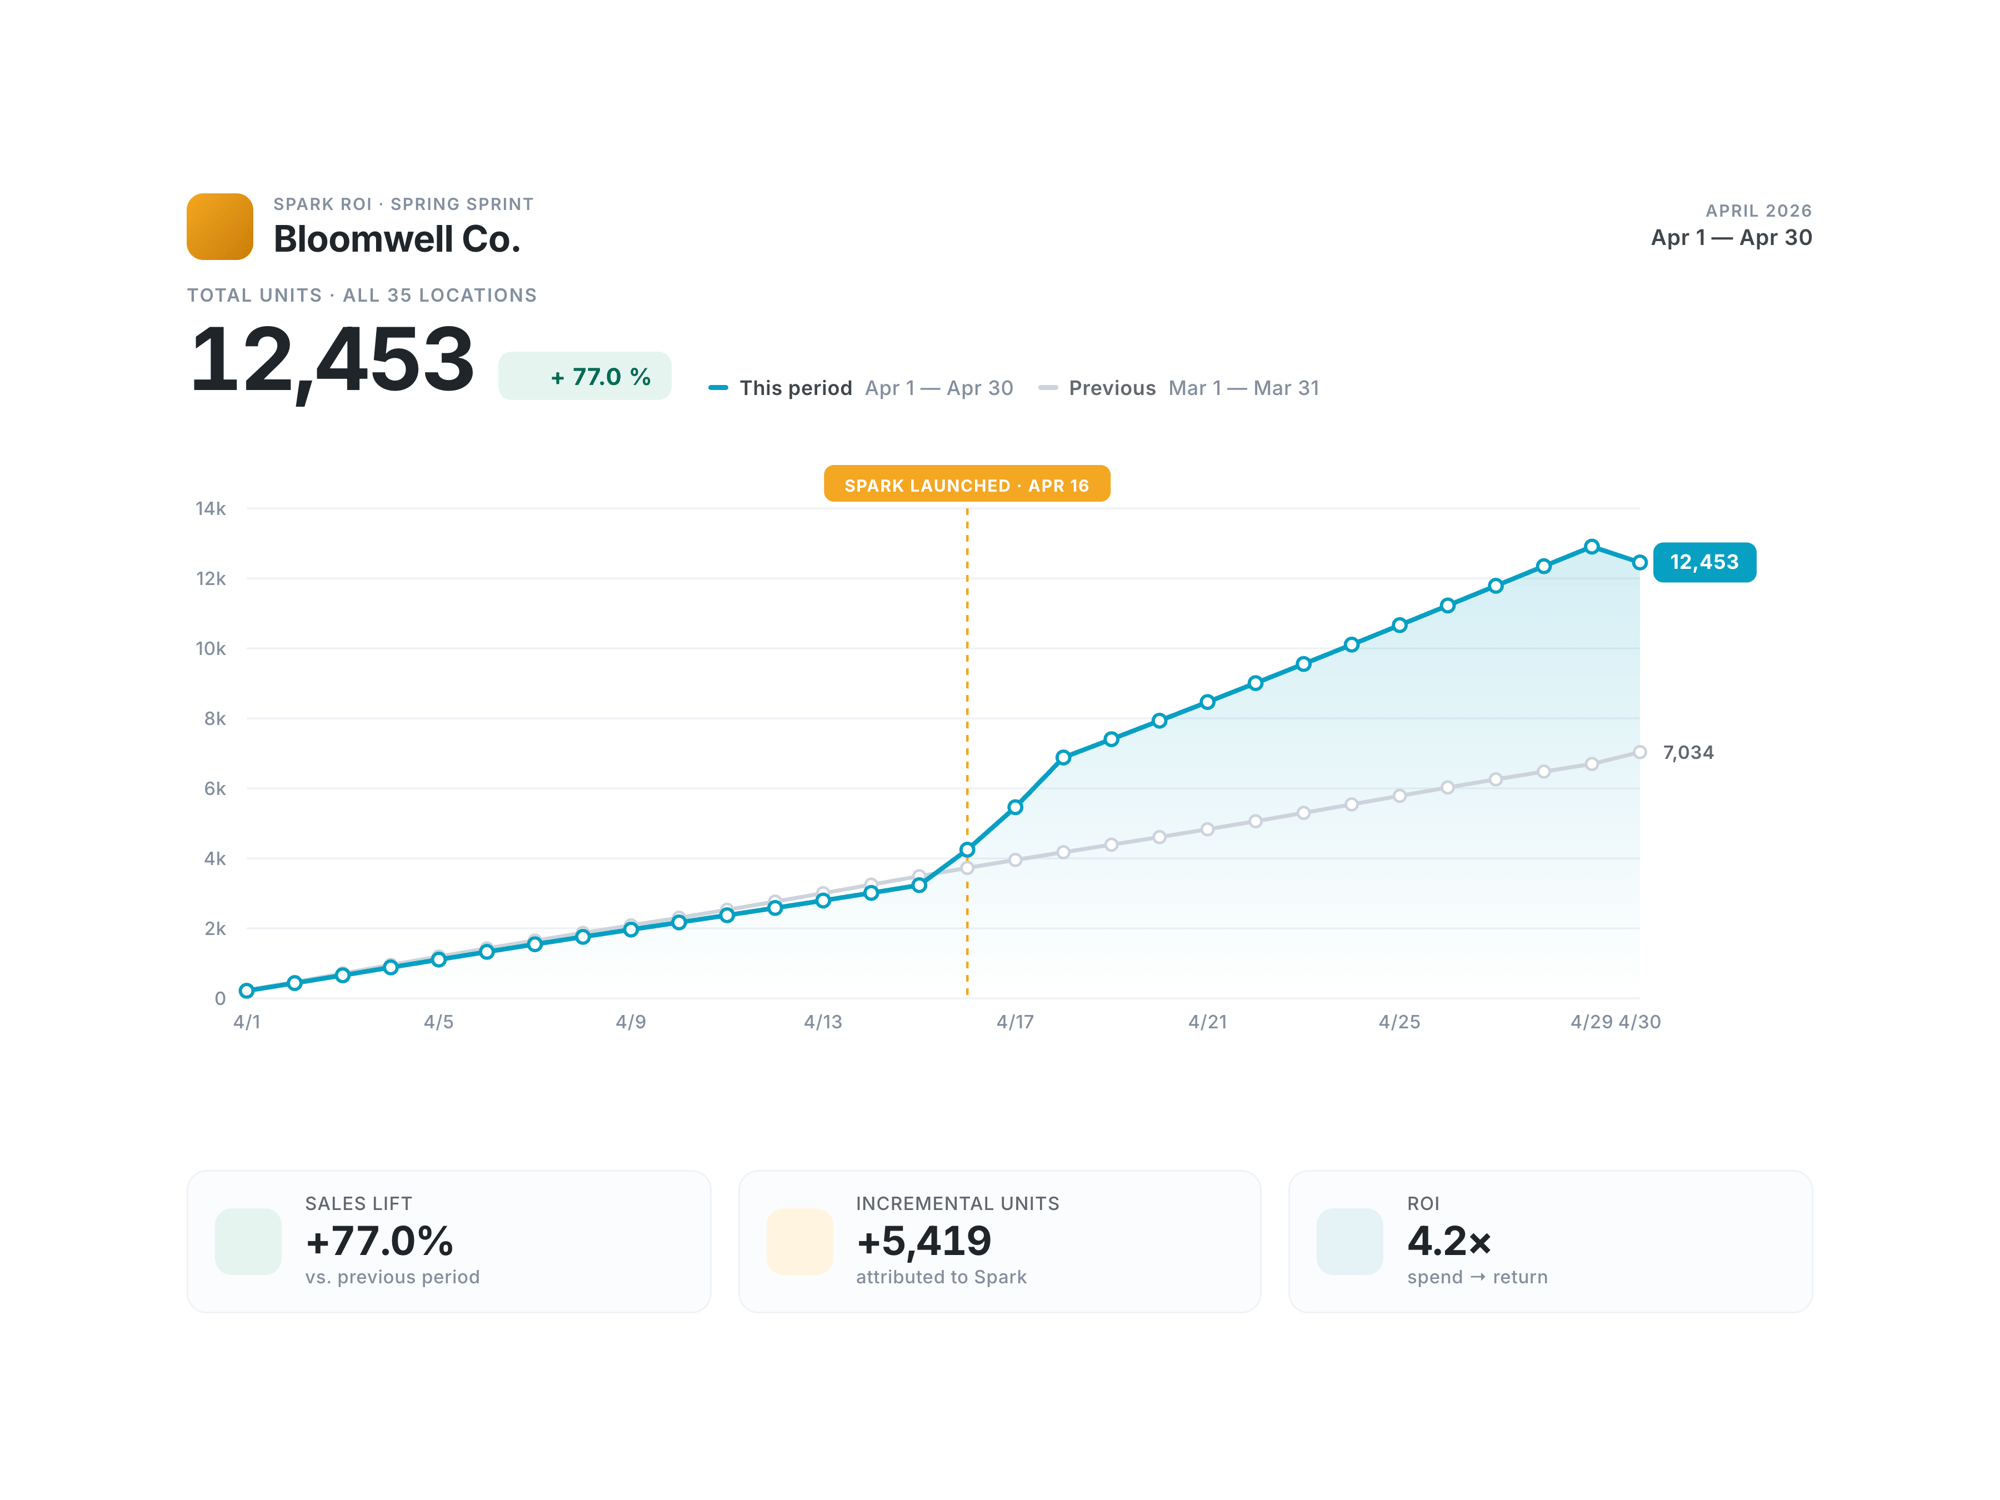
Campaign ROI You Can Actually Show
See exactly how each Spark incentive moves the needle. Compare sales before, during, and after every campaign with lift reporting that makes the value undeniable.
- Before / during / after comparisons— Isolate the impact of every Spark, not just the outcome.
- ROI by SKU, brand, or category— Know which products respond best to incentives and double down.
- Export-ready reports— Share clean, branded summaries with partners and stakeholders in one click.


Know Your Team
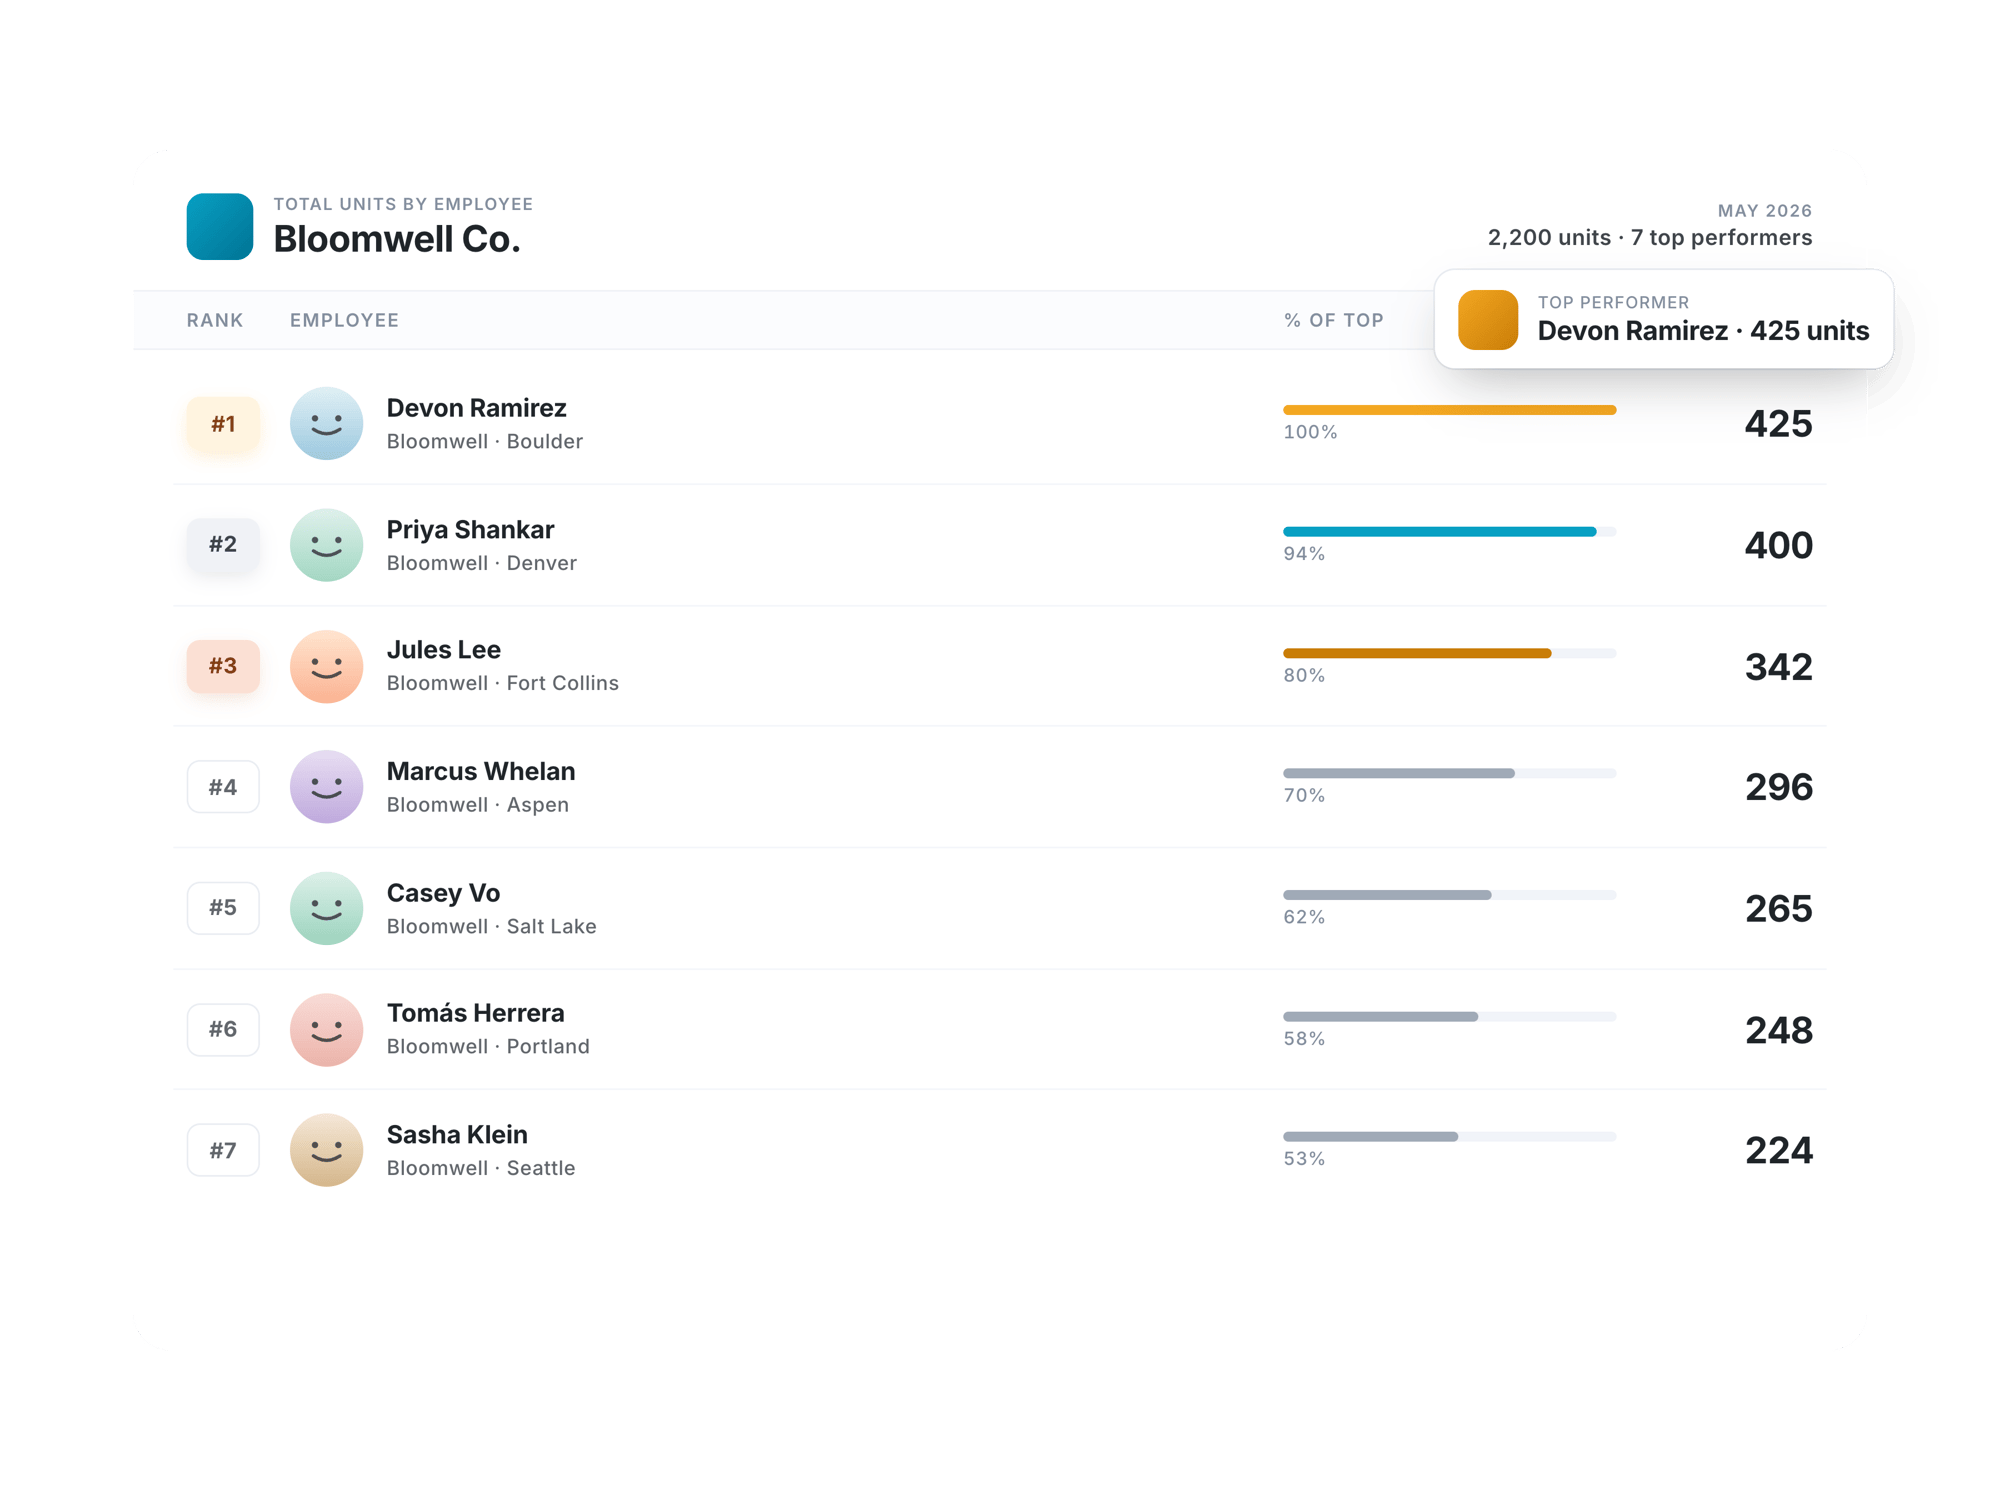
Employee Engagement & Participation
Understand who's in, who's not, and where to focus your coaching energy. Spot disengaged locations before the contest ends — not after.
- Participation rate by location— Instantly see which stores are activated and which need a nudge.
- Top performer leaderboards— Celebrate winners and surface rising talent across your network.
- Engagement trend tracking— Monitor how engagement evolves over the life of each campaign.